A guide for this tool is also available in video format here.
About the Tool
The Temporal map tool allows users to explore records across years and the meteorological seasons. This will be useful for visualising how records change over time. This tool is integrated into the Interactive map, for guidance on using this map see the Interactive map guide, e.g., including how to change how records are displayed on the map.
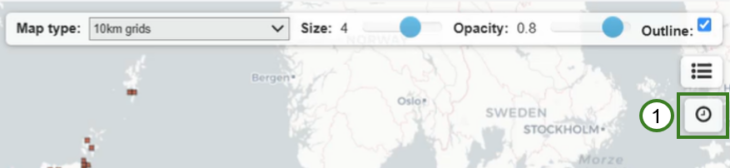
To enable the tool click on the clock icon on the Interactive map (1).
There are two options for this tool, Year (2) and Seasonal (3).
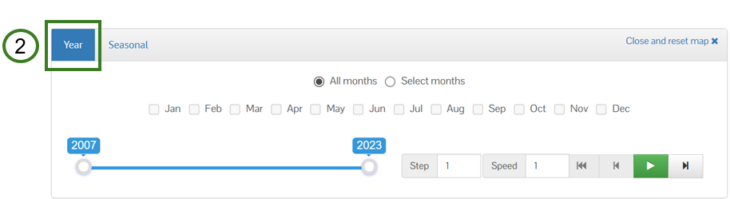
The Year selection allows you to play records across a selection of years and months. The Seasonal selection allows you to play records across a predefined meteorological season, showing records from all years for the selected season. The user can also alter the month selection if needed.
Using the Tool
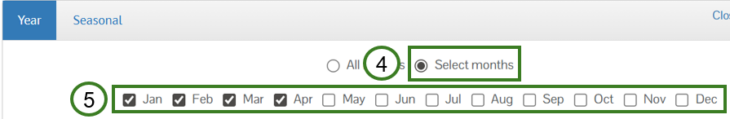
If using the Year selection, you can specify whether to include all months across the selected years for only a selection of months. To play records across a section of months, click the Select months (4) button and then select the months you want to be included (5).
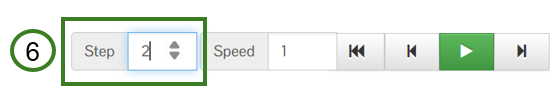
The Year selection option has a Step option (6), this sets interval of years to be played, e.g., set the Step value to 2 to play records for every two years across the years selection.
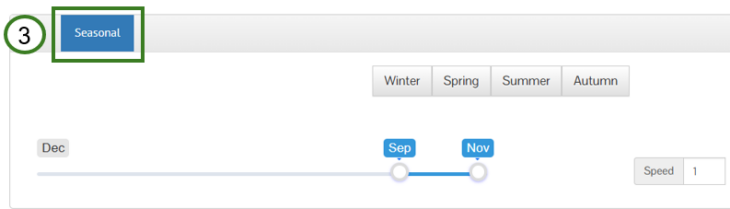
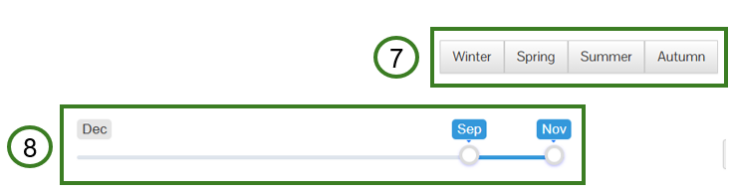
If using the Seasonal selection option, you will need to select the season you want to play the records for, e.g., Winter (7). The range selection will then show the months that will be included, you can alter the selection by moving the start or end of the slider (8).
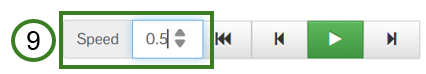
For both the Year and Seasonal selection options you can set the speed at which records play and appear on the map across the years or season. Use the Speed option (9) to increase or decrease the speed at which records play.
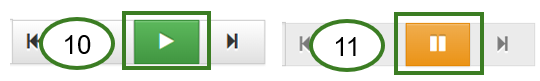
To start playing the records across the years or season click on the Play button (10). To pause the records being played, click the Pause button (11).
You can go back to the previous year by clicking on the Back button (12) or go to the next year by clicking the Forward button (13). You can also go back to the first year in the selection or the month in the selected season by clicking on the Restart button (14). You can only interact with these controls when the temporal map tool is paused.

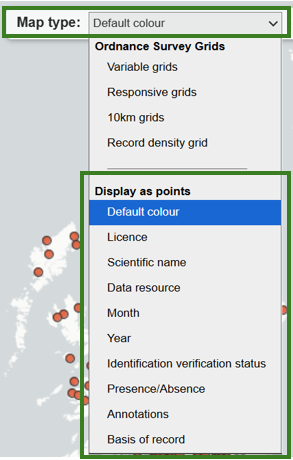
You may wish to pause the tool to explore the records. You can move around, zoom in and out of the map, and click on the grids or points (depending on the Map type option you have enabled, see the Interactive map guide for further information) to see the record’s details. We recommend if you want to explore record details on the map that you display the records as points. To do this click on the Map type option and choose an option from under the Display as points options.