The Interactive map allows you to quickly explore records in an occurrence search on a map. You can use this feature to create a map which you can then download (please be aware that records may be subject to licence conditions and you MUST adhere to these conditions, see Guidance on using data page for further information).
The Interactive map also includes the Temporal Map tool.
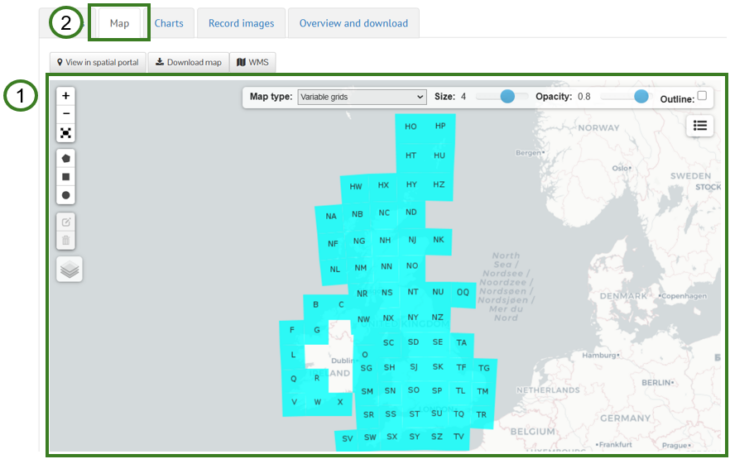
If you are looking to analyse the occurrence records, the NBN Atlas Spatial Portal may be a more appropriate tool, providing a suite of tools for spatial analysis and summarising records. See further guidance on using the NBN Atlas Spatial Portal here. You can easily view your occurrence search in the Spatial Portal from the Interactive map via the View in spatial portal button (see screenshot of the Interactive map below).
Navigating to the Interactive map
Species occurrence records can be viewed and explored using the Interactive map (1), which is located under the Map tab (2) on the Occurrence records page. You can navigate to the Occurrence records page from a species page, advance search, or location search options.
Applying additional filters to your search
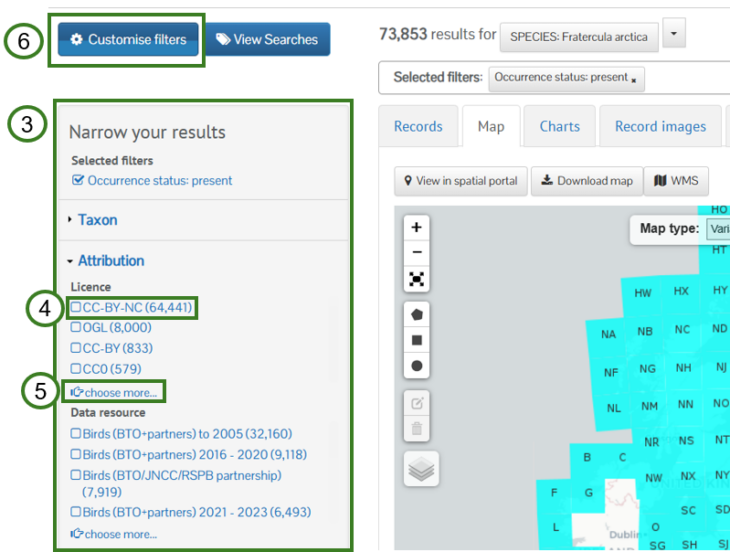
You can apply further filters to your search, e.g., filter by selected years, using the Narrow your results panel (3) by selecting a value/term you want to filter by (4) or a selection of values/terms by clicking the Choose more… link (5). Note you can customise the filter options via Customise filters (6).
Using the Interactive map
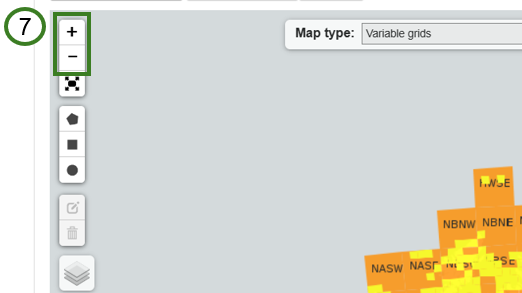
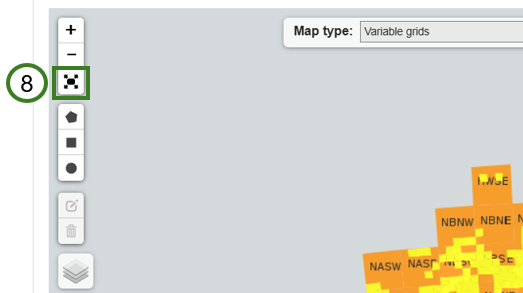
Use the + and – buttons on the left to zoom in or out (7) or double click on the point of the map you want to zoom in on. Click and drag anywhere on the map to move your view.
To view the map in full screen mode, click the full screen button (8), to escape full screen mode use your computer’s ‘Esc’ key.
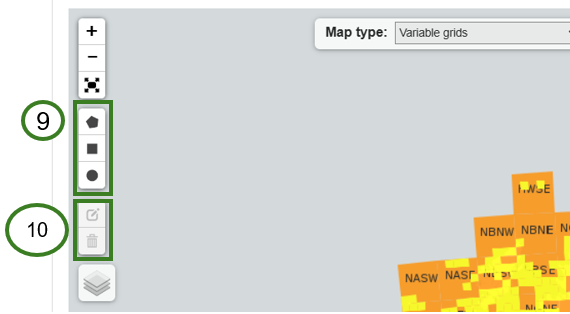
You can apply a spatial filter using the Interactive map by using the drawing tools (9). You can delete or edit these areas using the buttons below the drawing tools (10).
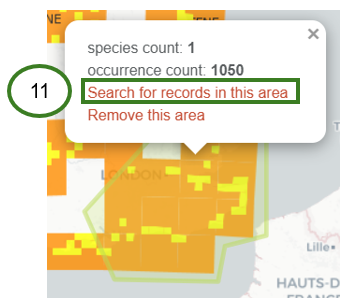
Once you have drawn your area, click on the Search for records in this area link (11) to apply the spatial filter.
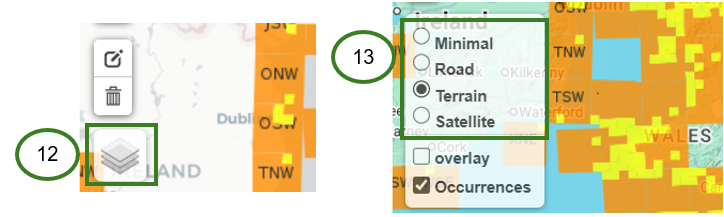
You can change the map base layer by hovering your mouse over the layer icon (12) and selecting a base layer option (13).
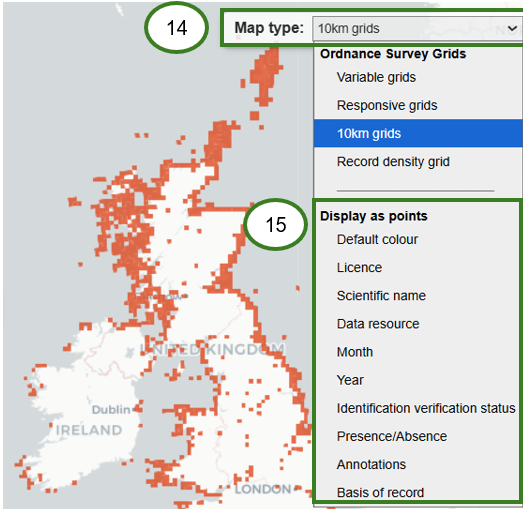
By default, the occurrence records are displayed as Variable grids, which update to show the highest resolution grid square a record has been recorded at as you zoom in and out of the map. You can change how the occurrence records are displayed using the Map type options (14), e.g., display as 10km grids or colour coded points (15).
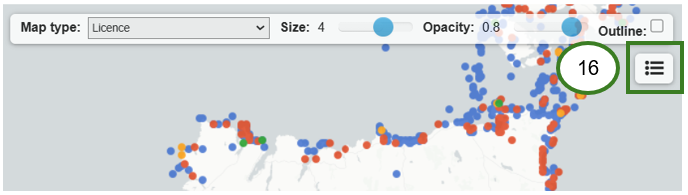
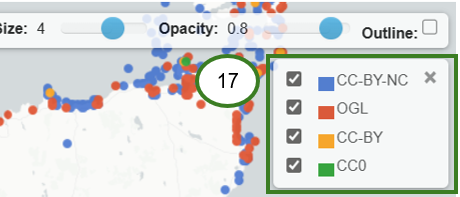
Click the map legend button (16) to see a colour legend (17), which is useful if viewing the records as colour coded points.
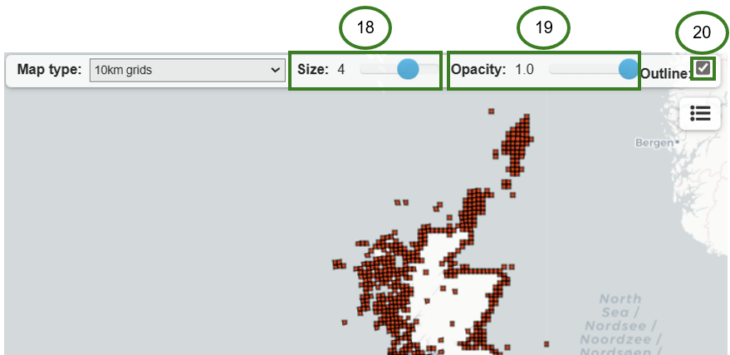
You can change the size (18), opacity (19), and whether the points/grids are outlined by clicking the Outline checkbox (20).
Downloading the map
You can use the Download map button to download the map shown on the Interactive map as a JPEG or PNG file.
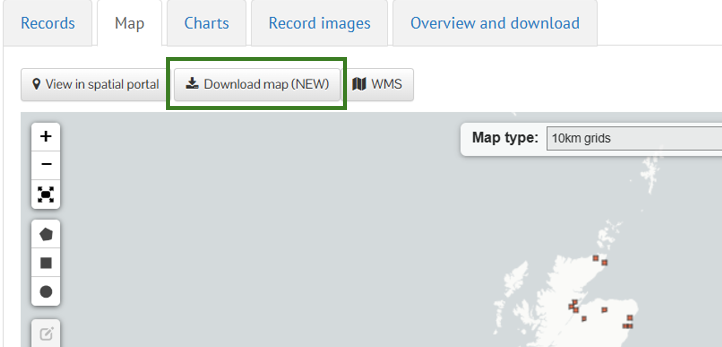
You can also download the citation and README file for the map via this button, including the citations for data partners, datasets, and NBN Atlas.
Exploring records on the map
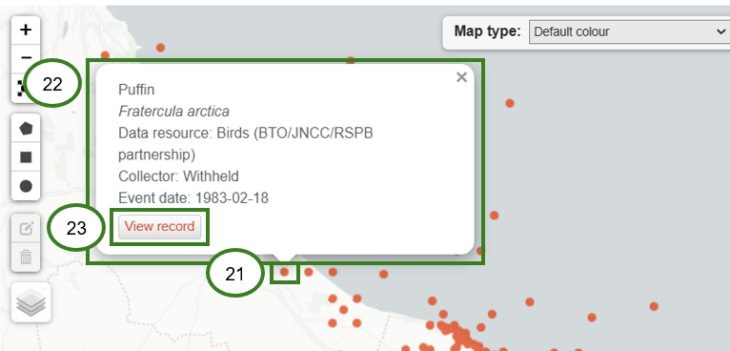
You can find out more about an occurrence record displayed on the map by clicking on the grid/point (21), note it is easier to pinpoint the record on the map if you use a Map type (14) option from under display as points (15). When you click on a point/grid, a pop up will show an overview of the record (22). To view the full details click the View record button (23).
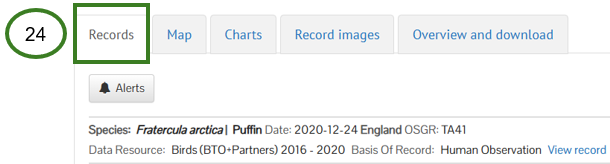
See the View species records page for guidance on exploring records via the list view under the Records tab (24) or guidance on the full records detail page.